
GDP, inflation, and the Fed: Keep calm and carry on
Chief Economist Eugenio J. Alemán discusses current economic conditions.
The reaction from markets to the release of Q1 2024 real GDP results has given every sector of the market another chance to give their own interpretation of what is coming regarding Federal Reserve (Fed) policy, inflation, and the federal funds rate. We have already started to hear that the Fed is not going to cut rates at all during the year; that it is only going to cut twice, or just once; that we are going into a stagflation process (we thought we had made the case clear that the current process has no similarities to the stagflation process of the 60s, 70s, and early 80s), just because of a worse than expected quarterly PCE price index number; that we are going into a recession because the yield curve has been inverted for too long, etc. In fact, the latter group – yield curve inversion group – has been consistent over time.
The only problem with some of this group’s thinking today is that while in the past they have argued for a recession and immediate interest rate cuts by the Fed, they seem to have jumped onto the ‘stagflation’ bandwagon, which argues that we will have a recession but with much higher inflation and no rate cuts. And then, there are those calling for the Fed to actually increase interest rates under the argument that it stopped rising interest rates too early.
What is important to remember is that this was the same market that was pricing in seven interest rate cuts in 2024 just four months ago!!
It is true that the rate of inflation during the first quarter of the year is not what markets were expecting, but we always said that the last stretch of the disinflationary process was going to be a long one. The Fed knows this, that is the reason why it expects to hit the 2% target in 2026, not today, not this year, not even in 2025. There is plenty of time for Fed policy to work its magic and the Fed has positioned itself to do that. It is true that the worse than expected result in the first quarter may delay the decision to start cutting interest rates to later this year. Please see the section on the following page where we discuss our changes. The truth is that nothing else has really changed from what we were expecting earlier this year or even last year.
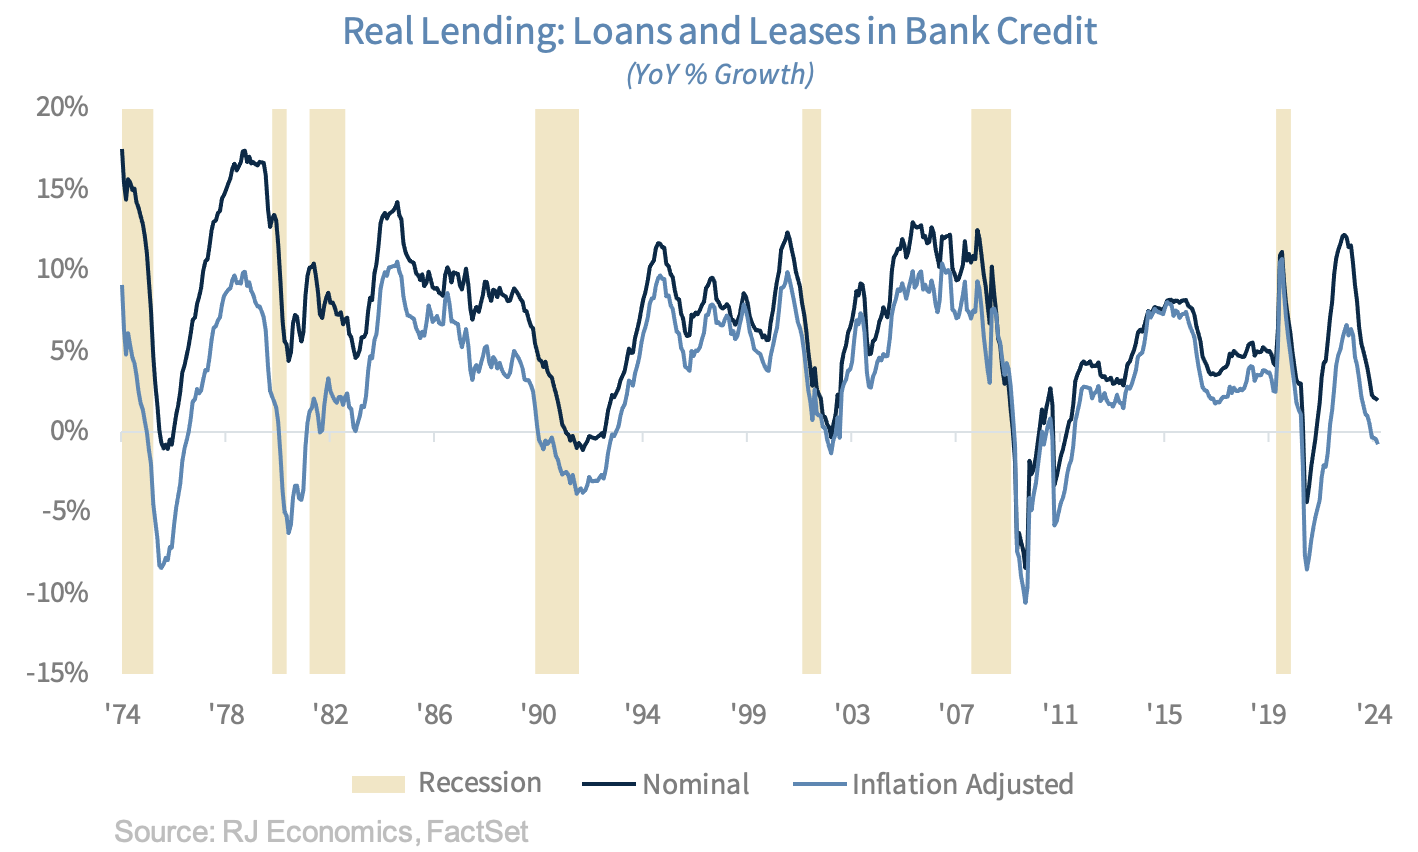
Our expectation for the disinflationary process to continue during the year remains intact. Thus, the Fed will achieve its goals with current interest rates so there is no need to increase interest rates further, as some have started to speculate. Lending is almost flat and even credit card lending has started to weaken, which was the only component of lending that remained a concern for the Fed, as the graph below clearly shows. Furthermore, real money supply growth has remained in negative territory, which is what the Fed needs to keep inflation on its disinflationary path.
Perhaps one of the potential arguments for the Fed to increase interest rates today is if it wants to slow consumption, as higher interest rates increase the trade-off between consuming today versus consuming tomorrow. However, the Fed doesn’t need to do that today because long term interest rates are moving higher anyway even as the Fed has kept the federal funds rate fixed. And this, if sustained, should do the trick for the Fed. Thus, even that argument for higher interest rates is not a compelling one today.
Furthermore, today’s monthly personal income and consumption report for March confirmed our suspicions that yesterday’s 1Q GDP report was a ‘nothingburger’ and that the Fed, and markets, should Keep Calm and Carry On!
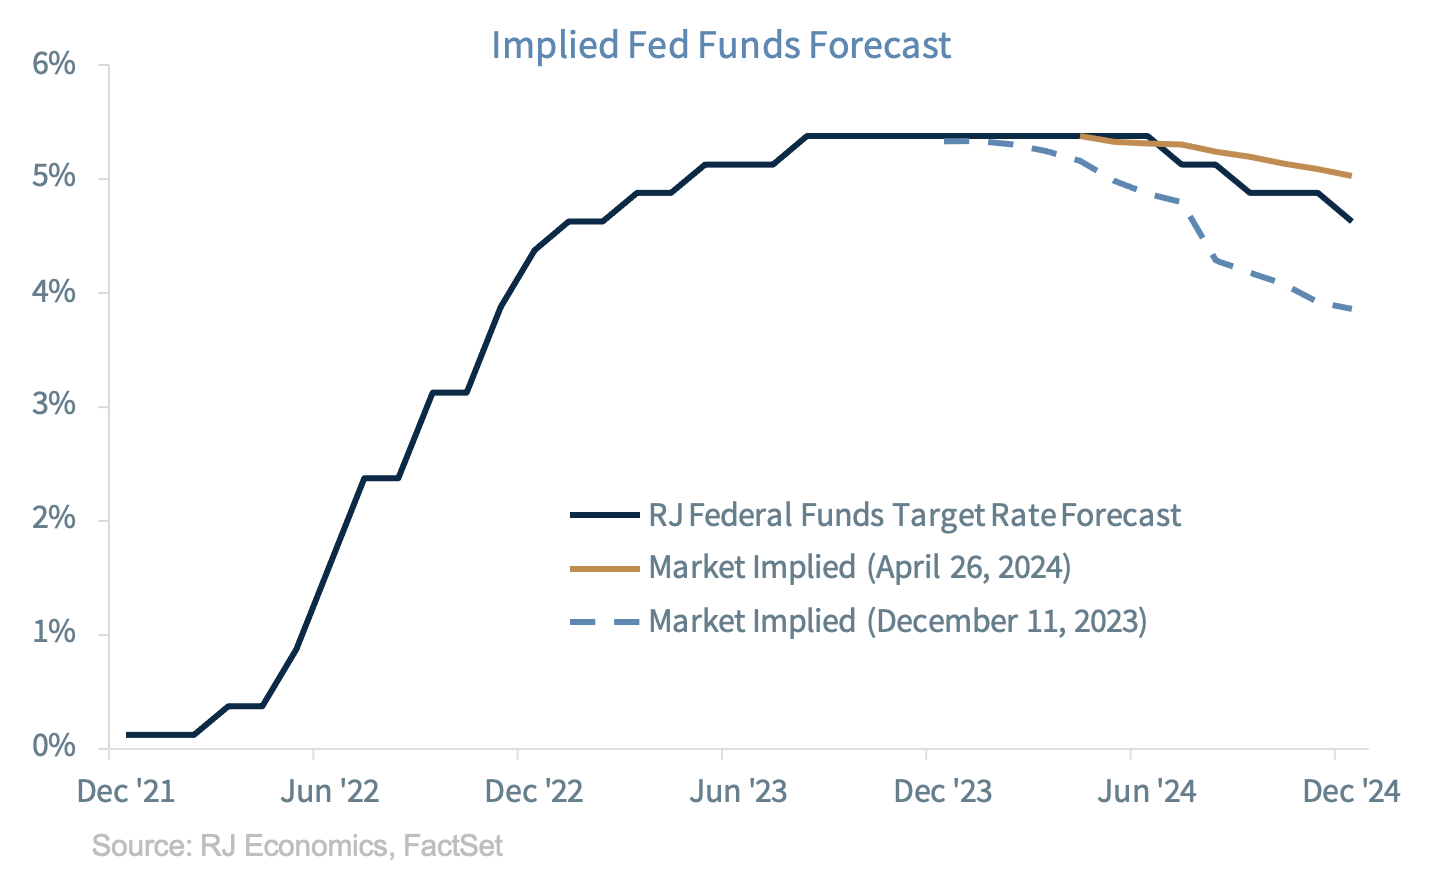
Changes to Our Federal Funds Rate Forecast
After considering the higher than expected inflation print during the first quarter of the year we are making a slight change to our federal funds rate forecast. We are keeping, for now, our call for three rate cuts but we are changing our expectation for the first Fed cut to July rather than June. This will give us an opportunity to see June’s dot-plot in order to gauge what effects, if any, first quarter inflation numbers have had on Fed members’ views on the policy target. Thus, we are now expecting cuts in the federal funds rate in July, September, and December.
Economic and market conditions are subject to change.
Opinions are those of Investment Strategy and not necessarily those of Raymond James and are subject to change without notice. The information has been obtained from sources considered to be reliable, but we do not guarantee that the foregoing material is accurate or complete. There is no assurance any of the trends mentioned will continue or forecasts will occur. Last performance may not be indicative of future results.
Consumer Price Index is a measure of inflation compiled by the US Bureau of Labor Statistics. Currencies investing is generally considered speculative because of the significant potential for investment loss. Their markets are likely to be volatile and there may be sharp price fluctuations even during periods when prices overall are rising.
Consumer Sentiment is a consumer confidence index published monthly by the University of Michigan. The index is normalized to have a value of 100 in the first quarter of 1966. Each month at least 500 telephone interviews are conducted of a contiguous United States sample.
Personal Consumption Expenditures Price Index (PCE): The PCE is a measure of the prices that people living in the United States, or those buying on their behalf, pay for goods and services. The change in the PCE price index is known for capturing inflation (or deflation) across a wide range of consumer expenses and reflecting changes in consumer behavior.
The Consumer Confidence Index (CCI) is a survey, administered by The Conference Board, that measures how optimistic or pessimistic consumers are regarding their expected financial situation. A value above 100 signals a boost in the consumers’ confidence towards the future economic situation, as a consequence of which they are less prone to save, and more inclined to consume. The opposite applies to values under 100.
Certified Financial Planner Board of Standards Inc. owns the certification marks CFP®, CERTIFIED FINANCIAL PLANNER™, CFP® (with plaque design) and CFP® (with flame design) in the U.S., which it awards to individuals who successfully complete CFP Board's initial and ongoing certification requirements.
Links are being provided for information purposes only. Raymond James is not affiliated with and does not endorse, authorize or sponsor any of the listed websites or their respective sponsors. Raymond James is not responsible for the content of any website or the collection or use of information regarding any website's users and/or members.
GDP Price Index: A measure of inflation in the prices of goods and services produced in the United States. The gross domestic product price index includes the prices of U.S. goods and services exported to other countries. The prices that Americans pay for imports aren't part of this index.
The Conference Board Leading Economic Index: Intended to forecast future economic activity, it is calculated from the values of ten key variables.
The Conference Board Coincident Economic Index: An index published by the Conference Board that provides a broad-based measurement of current economic conditions.
The Conference Board lagging Economic Index: an index published monthly by the Conference Board, used to confirm and assess the direction of the economy's movements over recent months.
The U.S. Dollar Index is an index of the value of the United States dollar relative to a basket of foreign currencies, often referred to as a basket of U.S. trade partners' currencies. The Index goes up when the U.S. dollar gains "strength" when compared to other currencies.
The FHFA House Price Index (FHFA HPI®) is a comprehensive collection of public, freely available house price indexes that measure changes in single-family home values based on data from all 50 states and over 400 American cities that extend back to the mid-1970s.
Import Price Index: The import price index measure price changes in goods or services purchased from abroad by U.S. residents (imports) and sold to foreign buyers (exports). The indexes are updated once a month by the Bureau of Labor Statistics (BLS) International Price Program (IPP).
ISM New Orders Index: ISM New Order Index shows the number of new orders from customers of manufacturing firms reported by survey respondents compared to the previous month. ISM Employment Index: The ISM Manufacturing Employment Index is a component of the Manufacturing Purchasing Managers Index and reflects employment changes from industrial companies.
ISM Inventories Index: The ISM manufacturing index is a composite index that gives equal weighting to new orders, production, employment, supplier deliveries, and inventories.
ISM Production Index: The ISM manufacturing index or PMI measures the change in production levels across the U.S. economy from month to month.
ISM Services PMI Index: The Institute of Supply Management (ISM) Non-Manufacturing Purchasing Managers' Index (PMI) (also known as the ISM Services PMI) report on Business, a composite index is calculated as an indicator of the overall economic condition for the non-manufacturing sector.
Consumer Price Index (CPI) A consumer price index is a price index, the price of a weighted average market basket of consumer goods and services purchased by households. Changes in measured CPI track changes in prices over time.
Producer Price Index: A producer price index (PPI) is a price index that measures the average changes in prices received by domestic producers for their output.
Industrial production: Industrial production is a measure of output of the industrial sector of the economy. The industrial sector includes manufacturing, mining, and utilities. Although these sectors contribute only a small portion of gross domestic product, they are highly sensitive to interest rates and consumer demand.
The NAHB/Wells Fargo Housing Opportunity Index (HOI) for a given area is defined as the share of homes sold in that area that would have been affordable to a family earning the local median income, based on standard mortgage underwriting criteria.
The S&P CoreLogic Case-Shiller U.S. National Home Price NSA Index measures the change in the value of the U.S. residential housing market by tracking the purchase prices of single-family homes.
The S&P CoreLogic Case-Shiller 20-City Composite Home Price NSA Index seeks to measures the value of residential real estate in 20 major U.S. metropolitan.
Source: FactSet, data as of 7/7/2023
